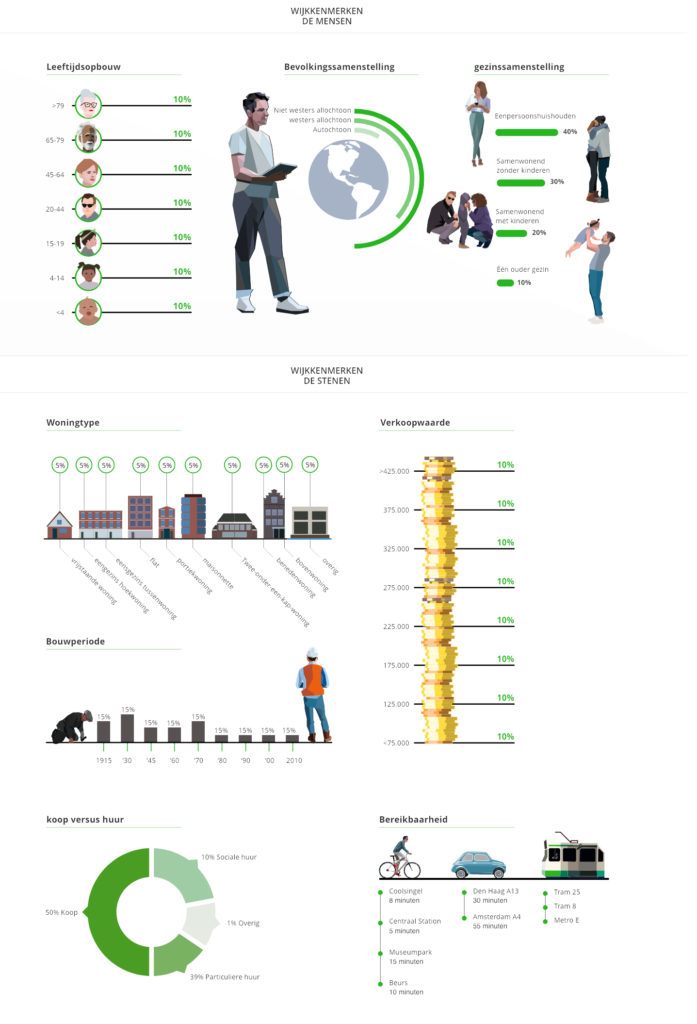
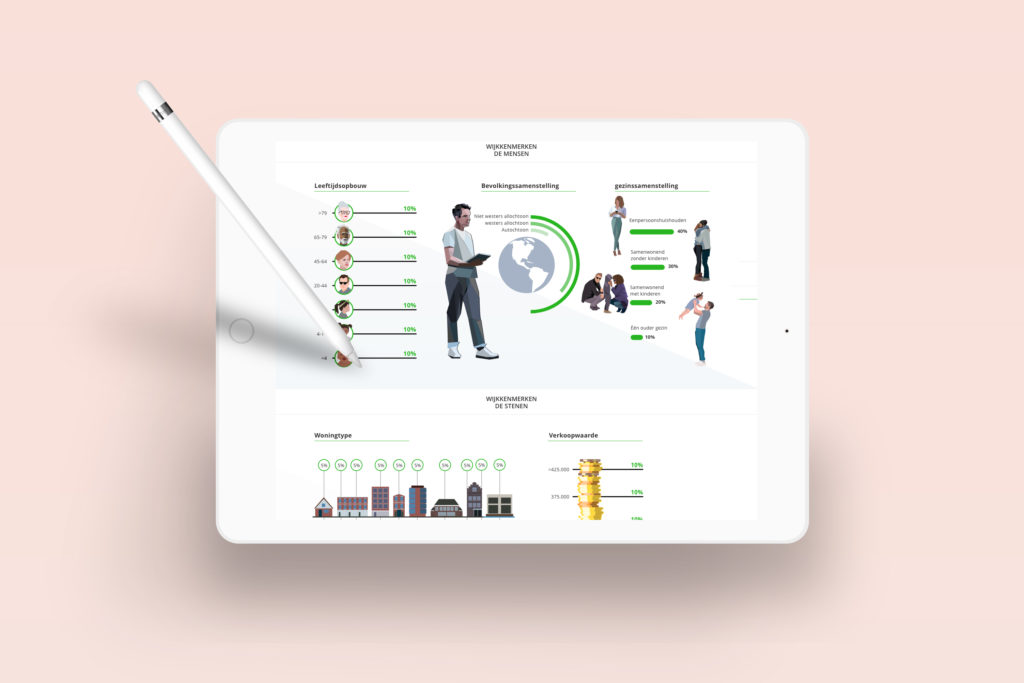
Wonen in Rotterdam needed a new illustration style for their site. Because they never used illustrations I made several styles from which they could chose. They wanted a modern style to show serious numbers.
The other interesting part from this assignment was, how to make the infographic as clear as possible. I categorized the tables by sort and used illustrations to tell the story of Rotterdam. I also made animations in my visual design to make the illustrations come alive. Underneath this post you can see some of the sketches I made. In the end we chose the style above. It’s friendly, not to childish but not too harsh. It helps read the infographic and that is in my opinion the reason to use illustrations in infographics. I used them to create a clear massage and not to distract.